Lighthouse Performance Scoring
The Performance Score is a weighted average of the Metric Scores.
where
Metric Scores
Once Lighthouse has gathered the performance metrics (mostly reported in milliseconds), it converts each raw metric value into a metric score from 0 to 100 by looking where the metric value falls on its Lighthouse Scoring Distribution (aka Individual Metric Curve).
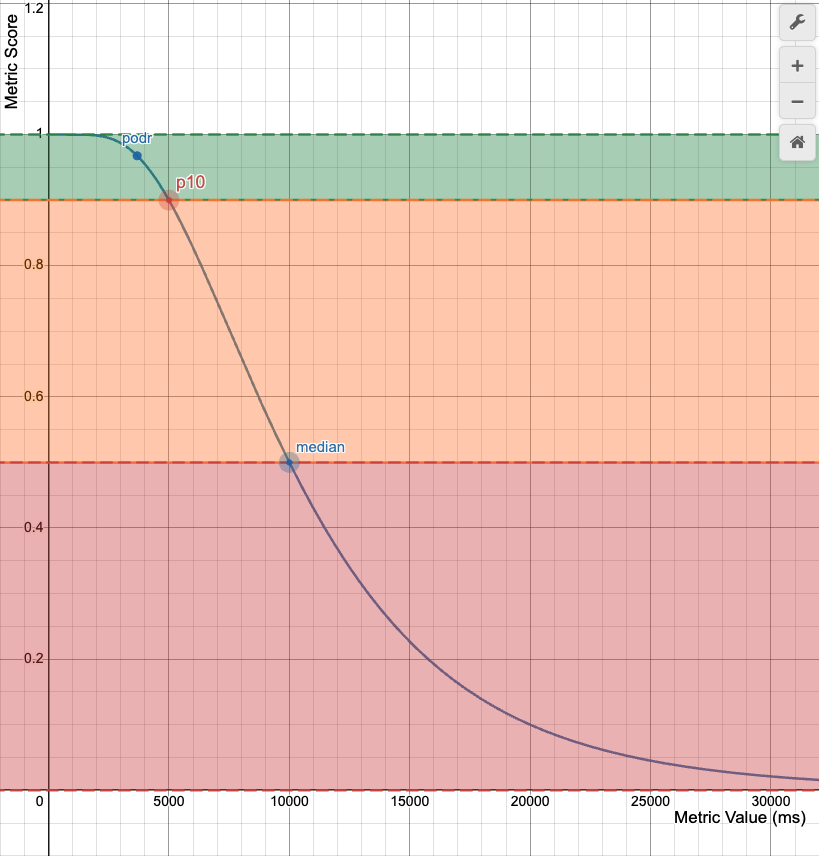
If is the raw metric expressed in milliseconds, then its related is equals to , where the Scoring Distribution is a log-normal distribution that defines a metric cure similar to the following one:

In the metric curve we have two control points:
- Median Control Point (Metric Score = 50): corresponds to the 25th percentile of HTTPArchive data.
- p10 (Metric Score = 90): corresponds to the 10th percentile of HTTPArchive data.
The podr (i.e. "point of diminishing returns") is a point, between 0.50 and 0.92, in which the scoring curve has a near-linear relationship between metric value and score. Scores above the "point of diminishing returns" requires an increasingly more metric improvement to improve an already high score.
How scores are color-coded
The Metrics Scores, and the Performance Score, are colored according to these ranges:
- 0 to 49 (red): Poor
- 50 to 89 (orange): Needs Improvement
- 90 to 100 (green): Good
To provide a good user experience, sites should strive to have a good score (90-100). A "perfect" score of 100 is extremely challenging to achieve and not expected.